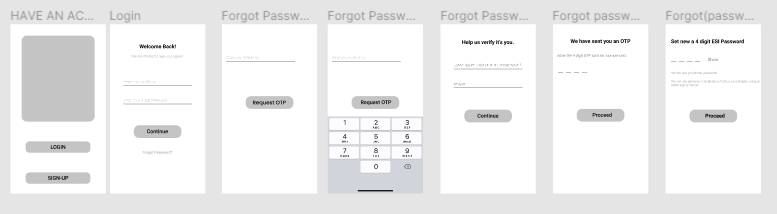
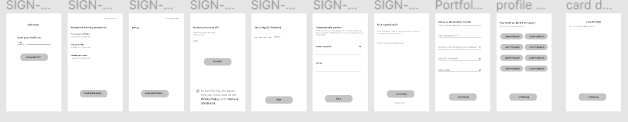
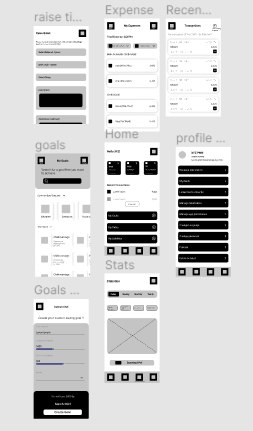
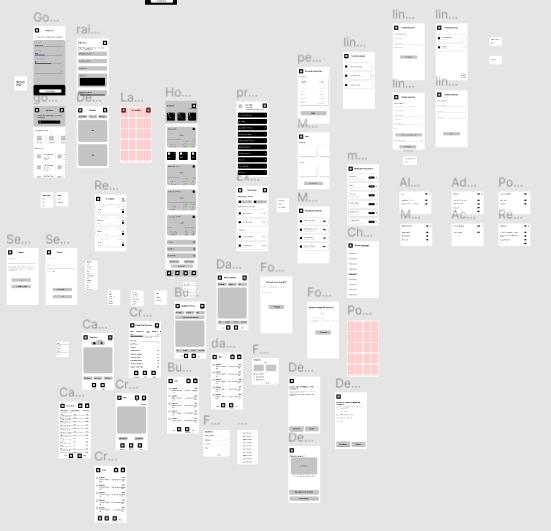
ESI
Product Designer Intern
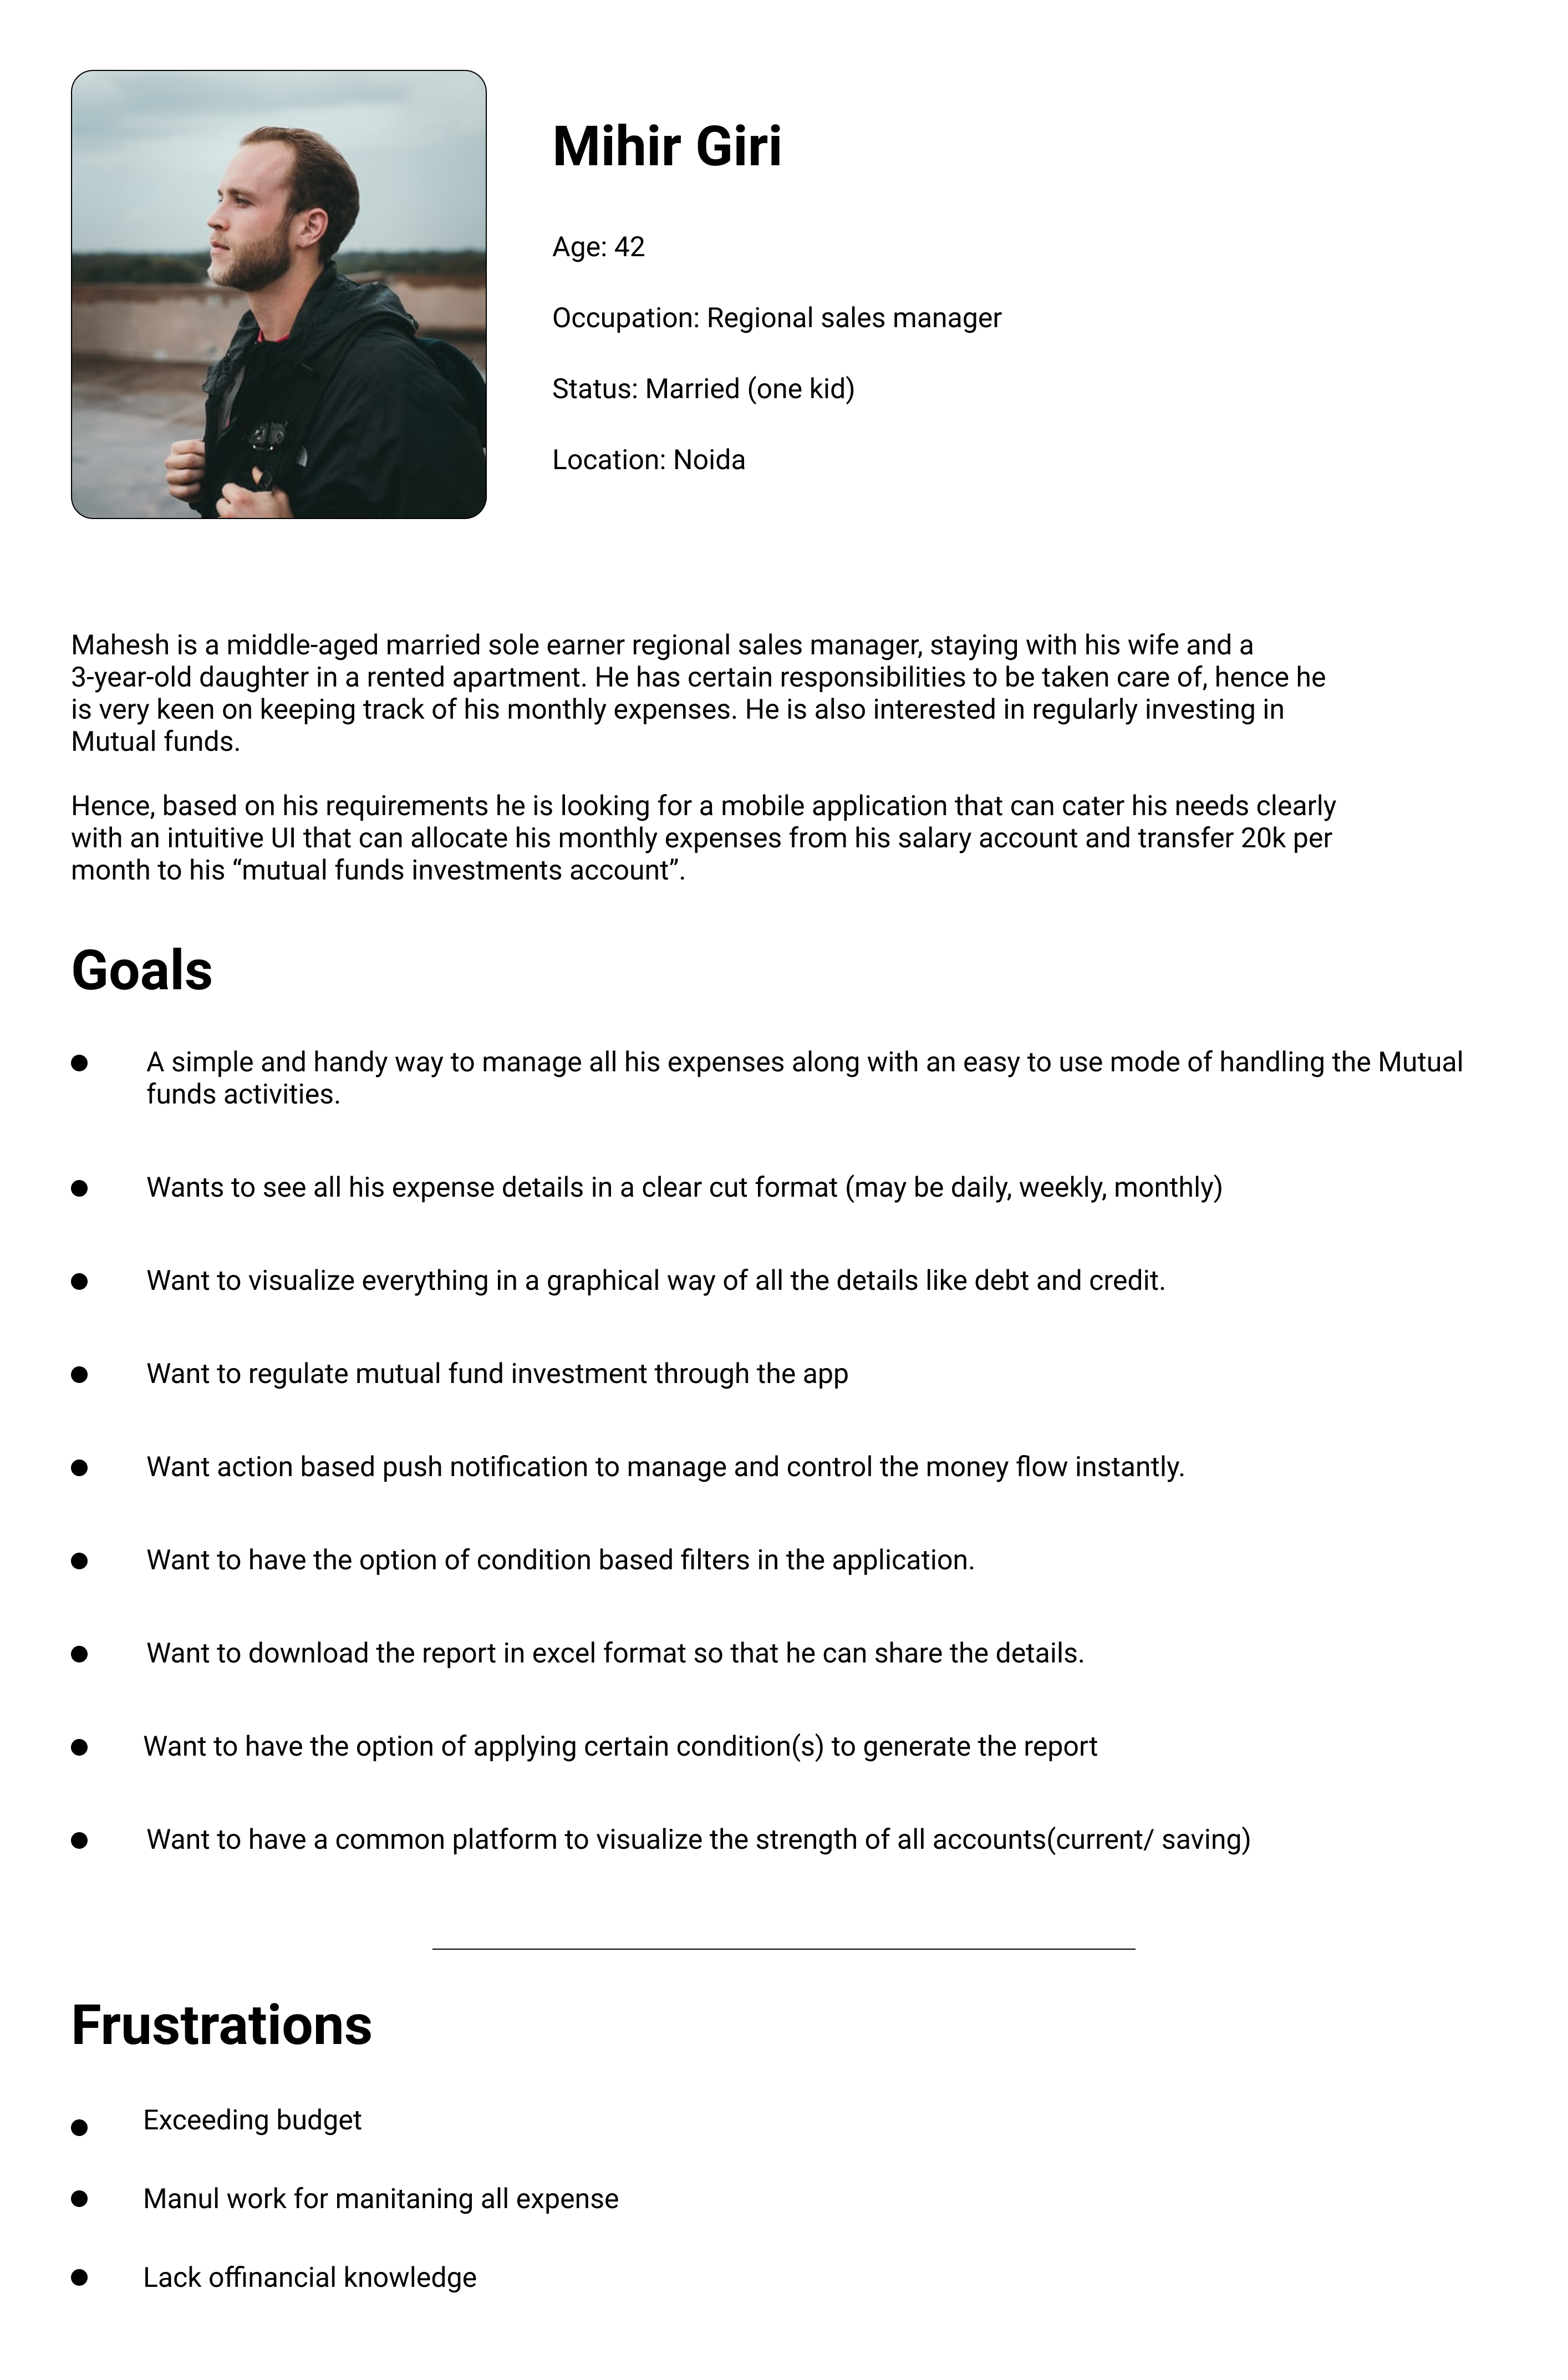
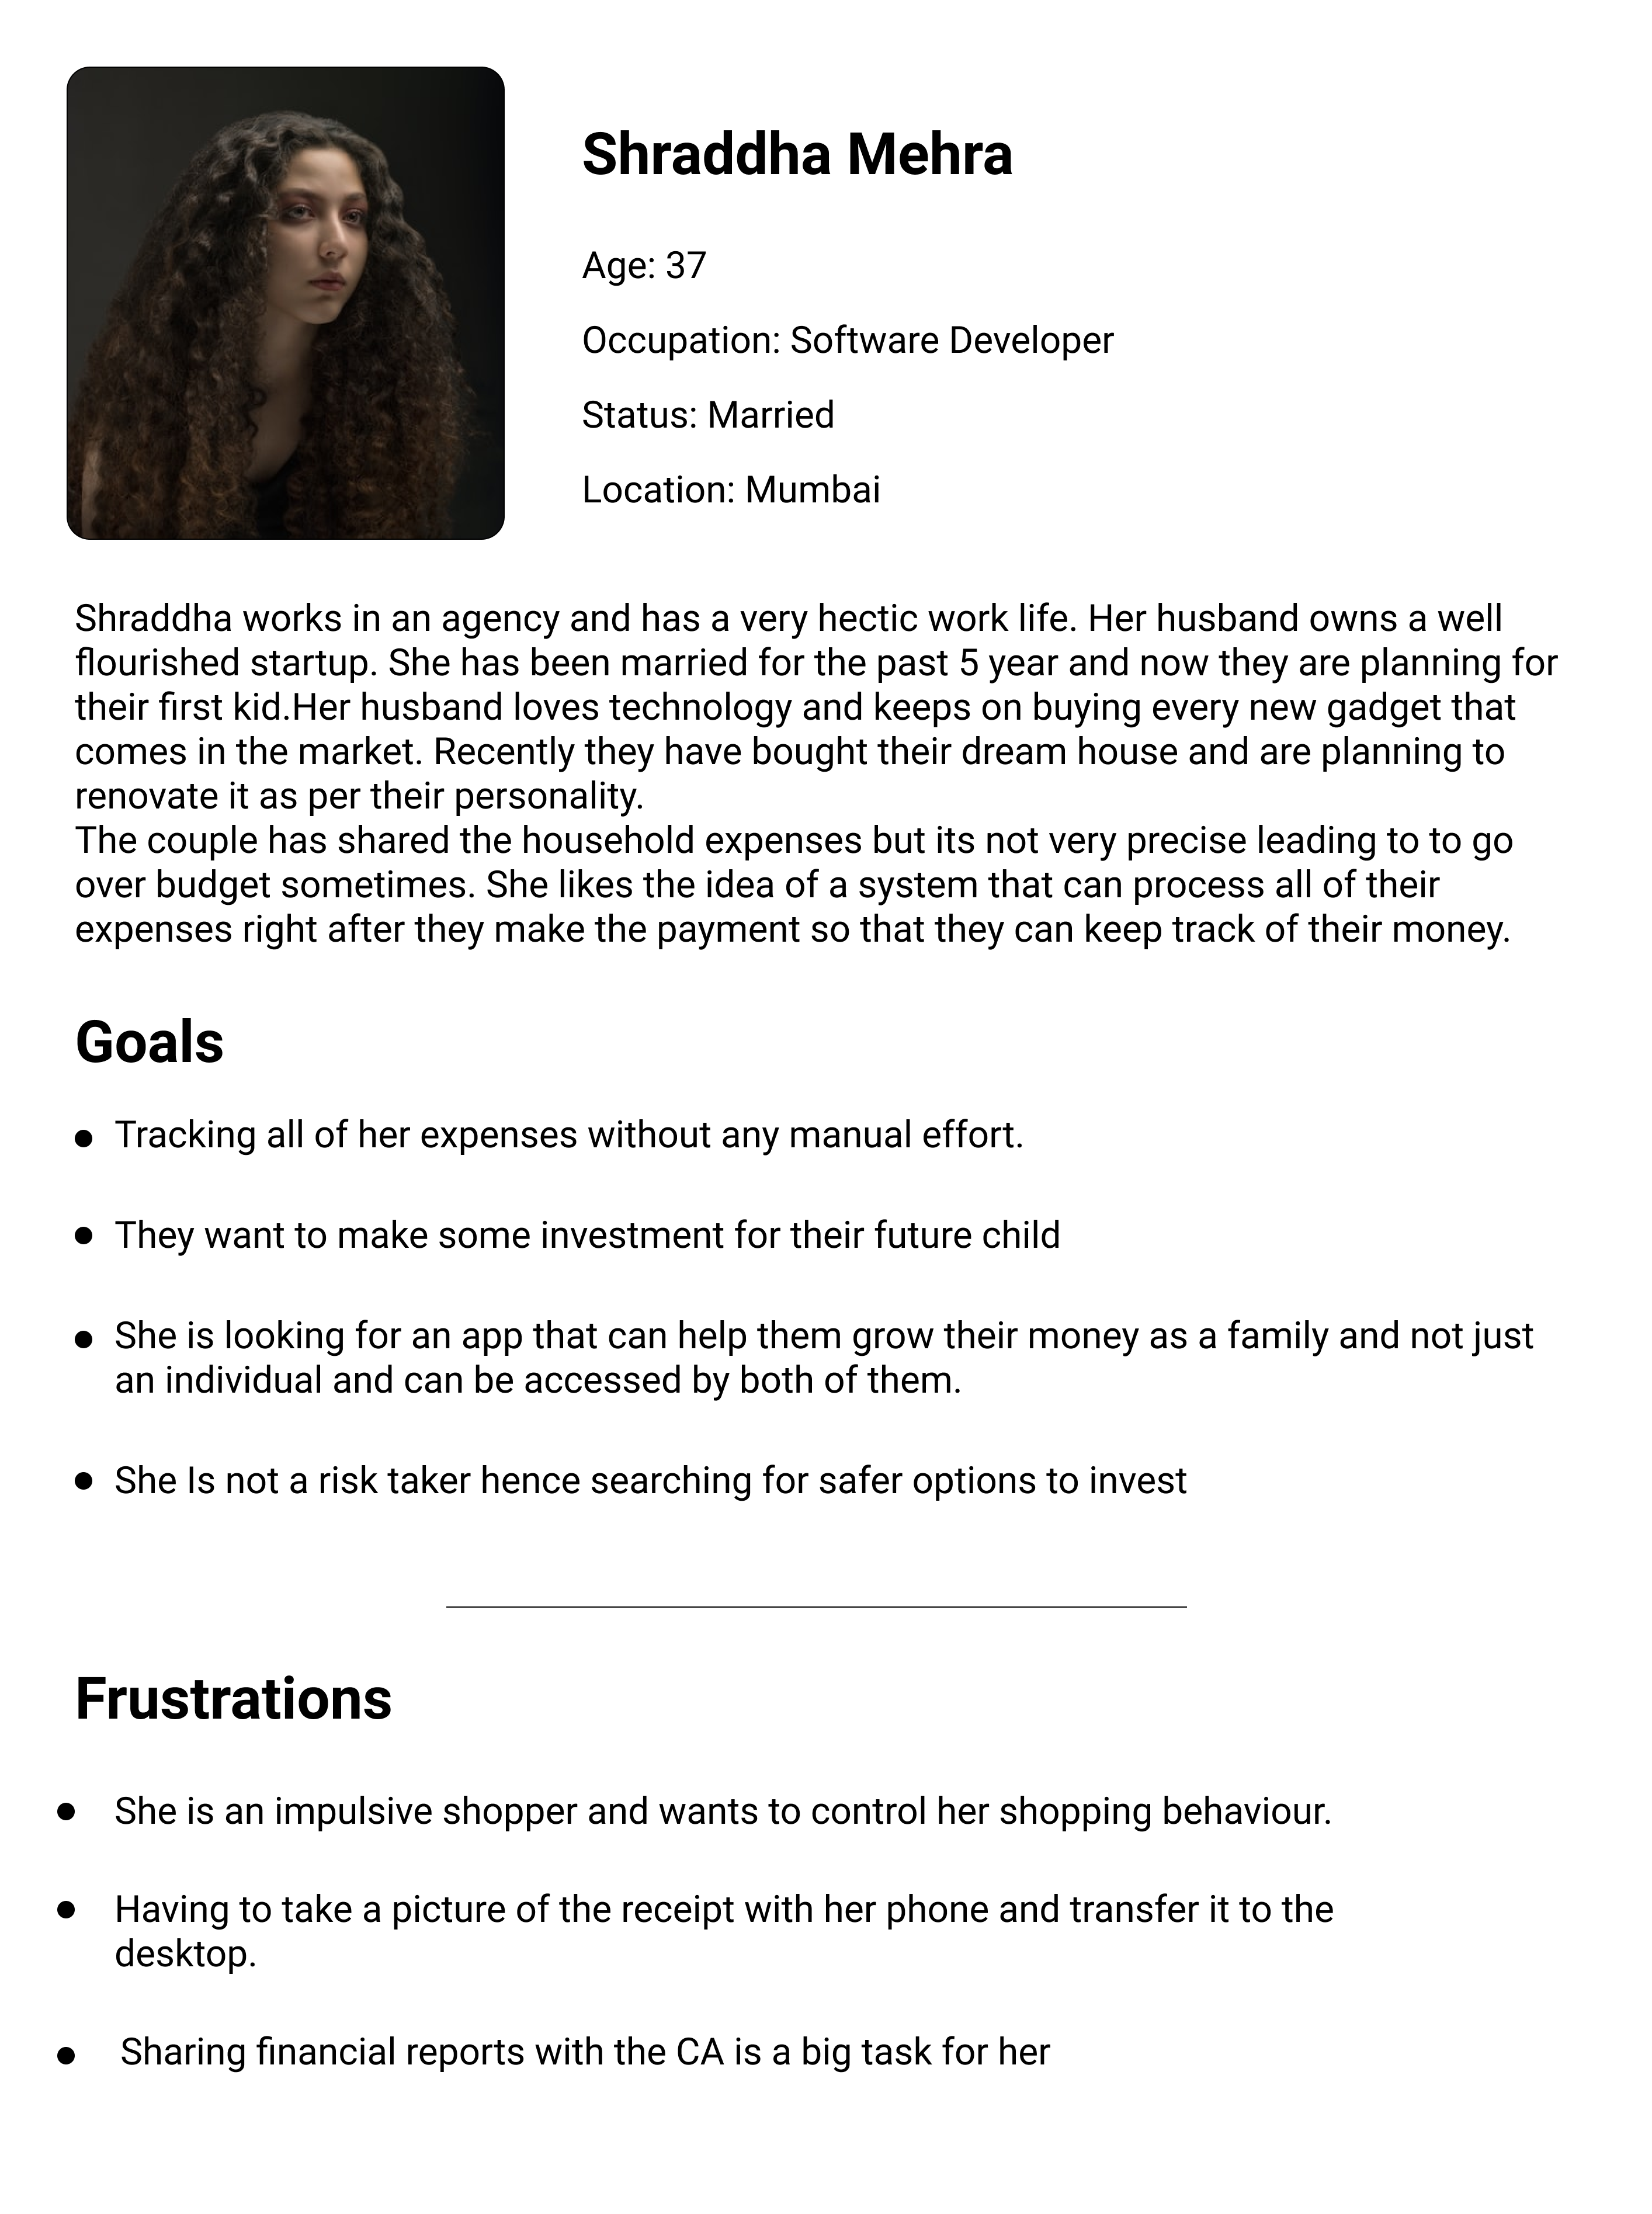
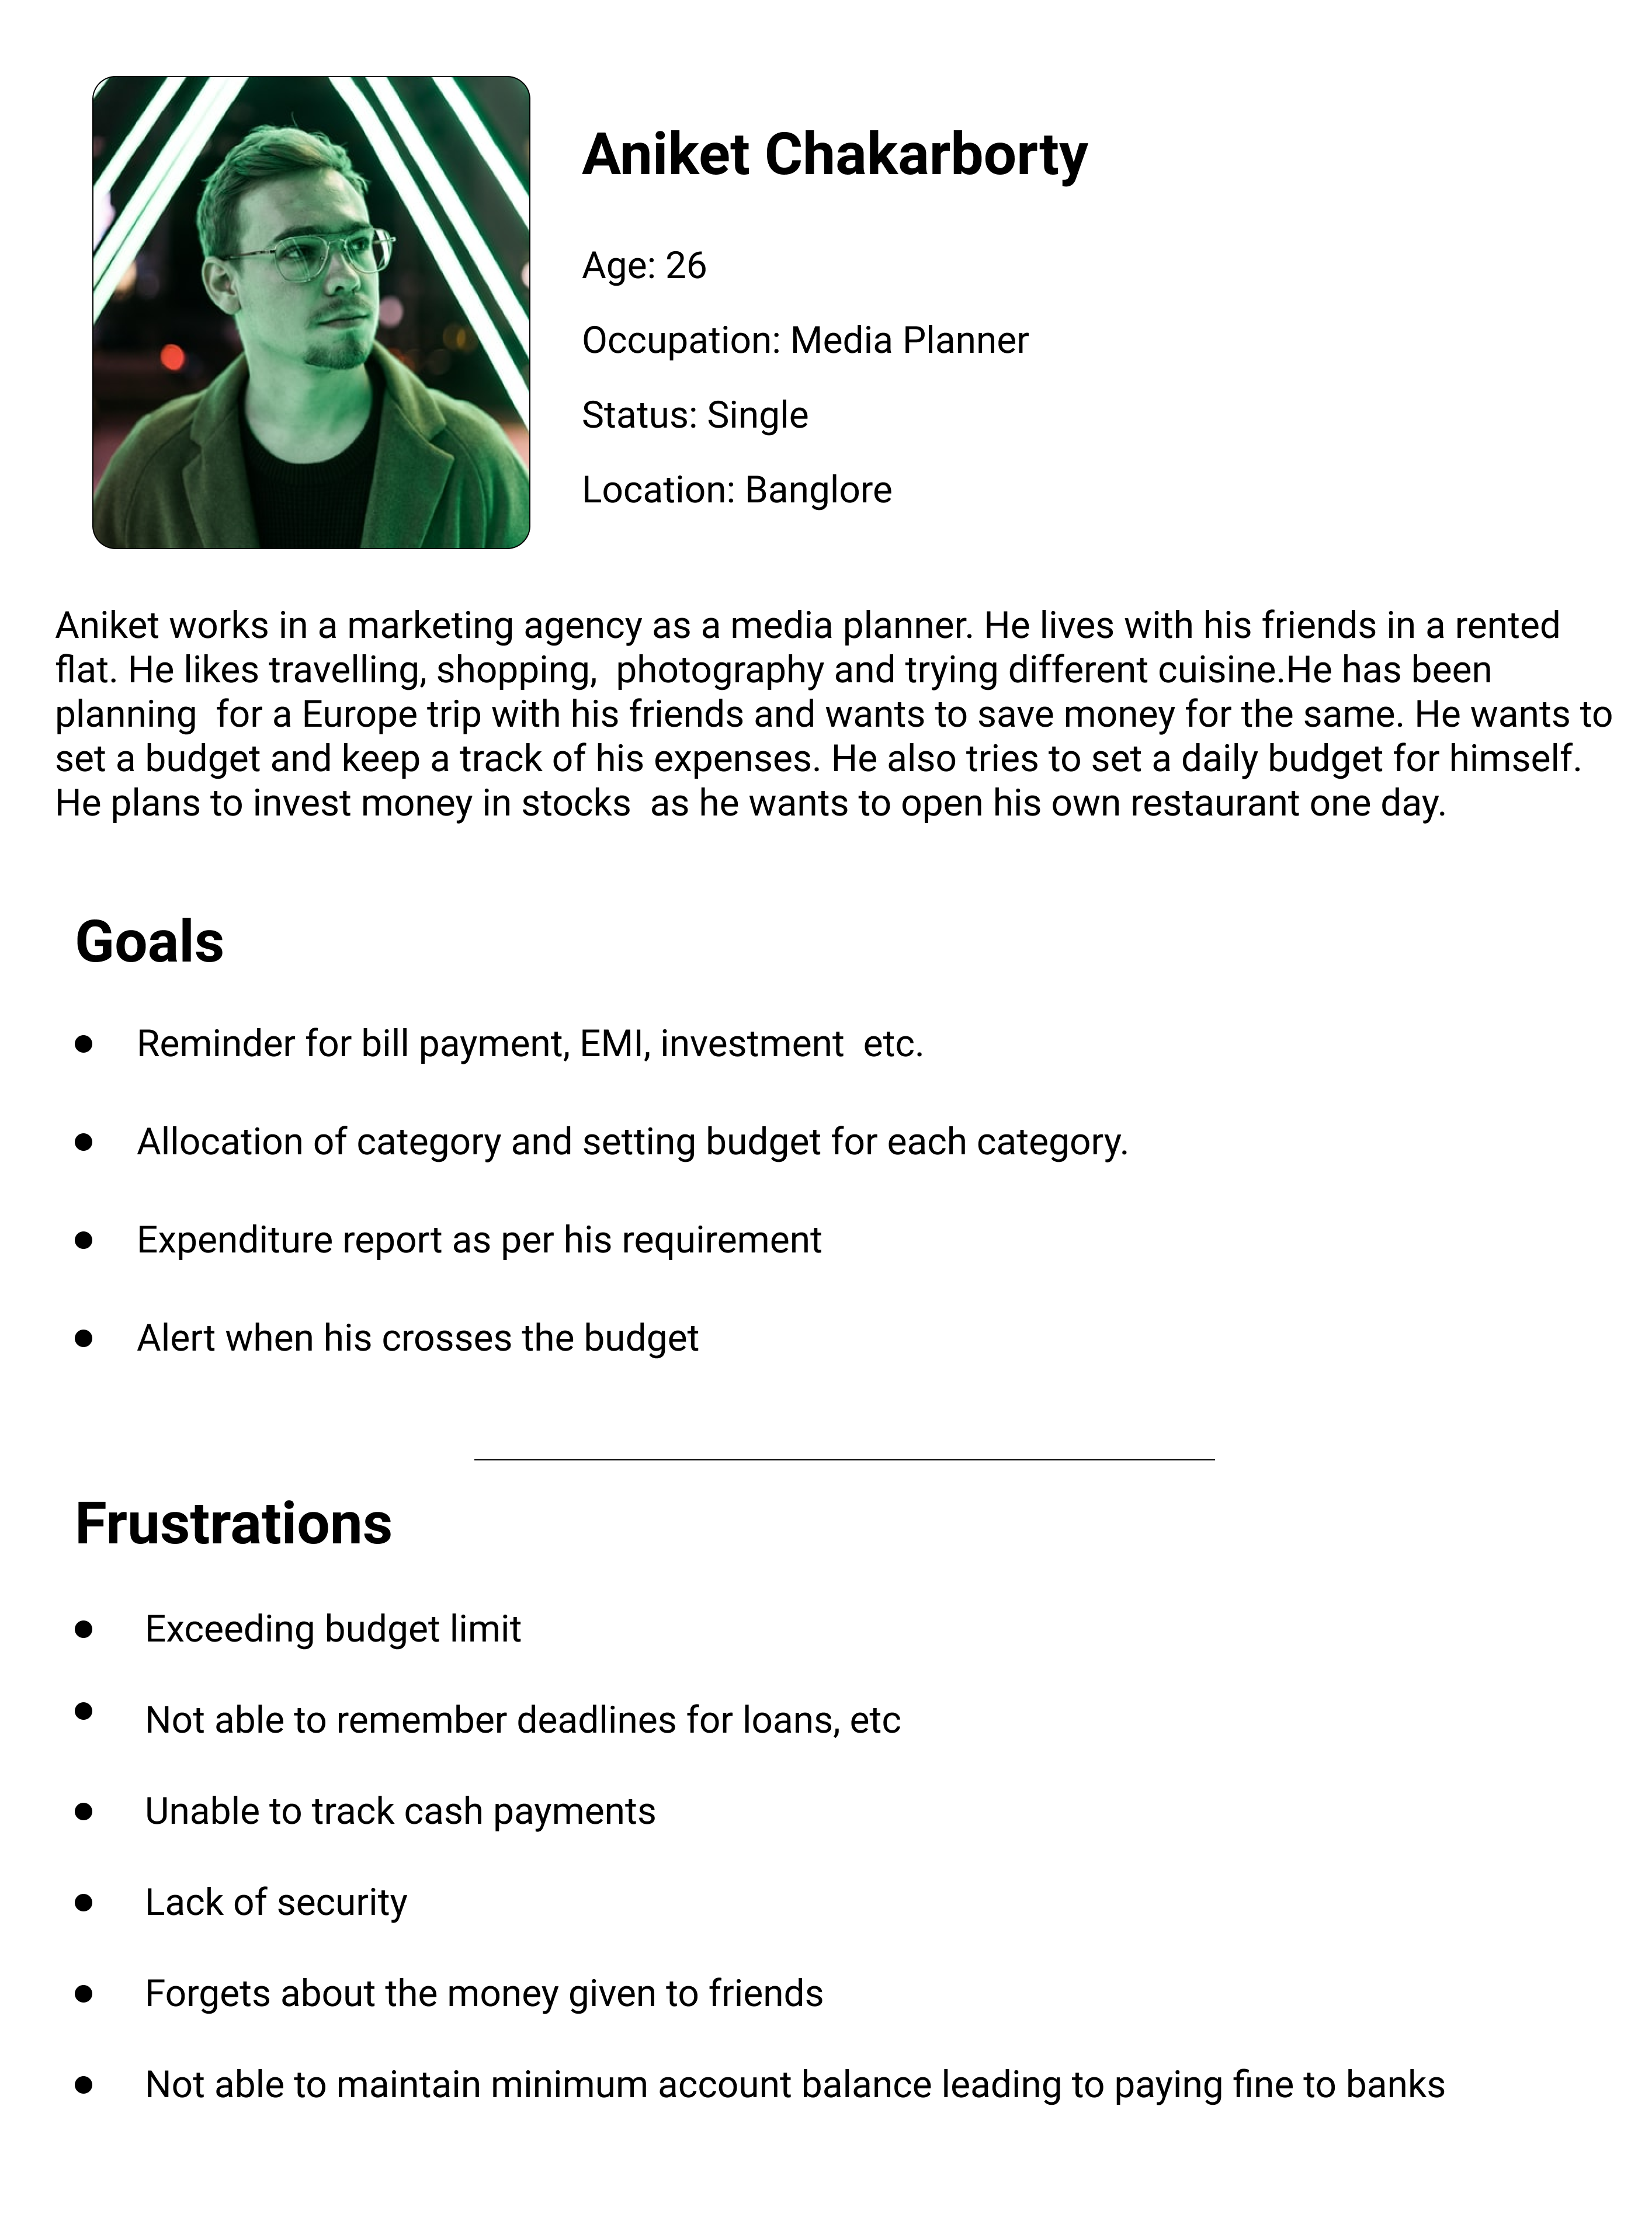
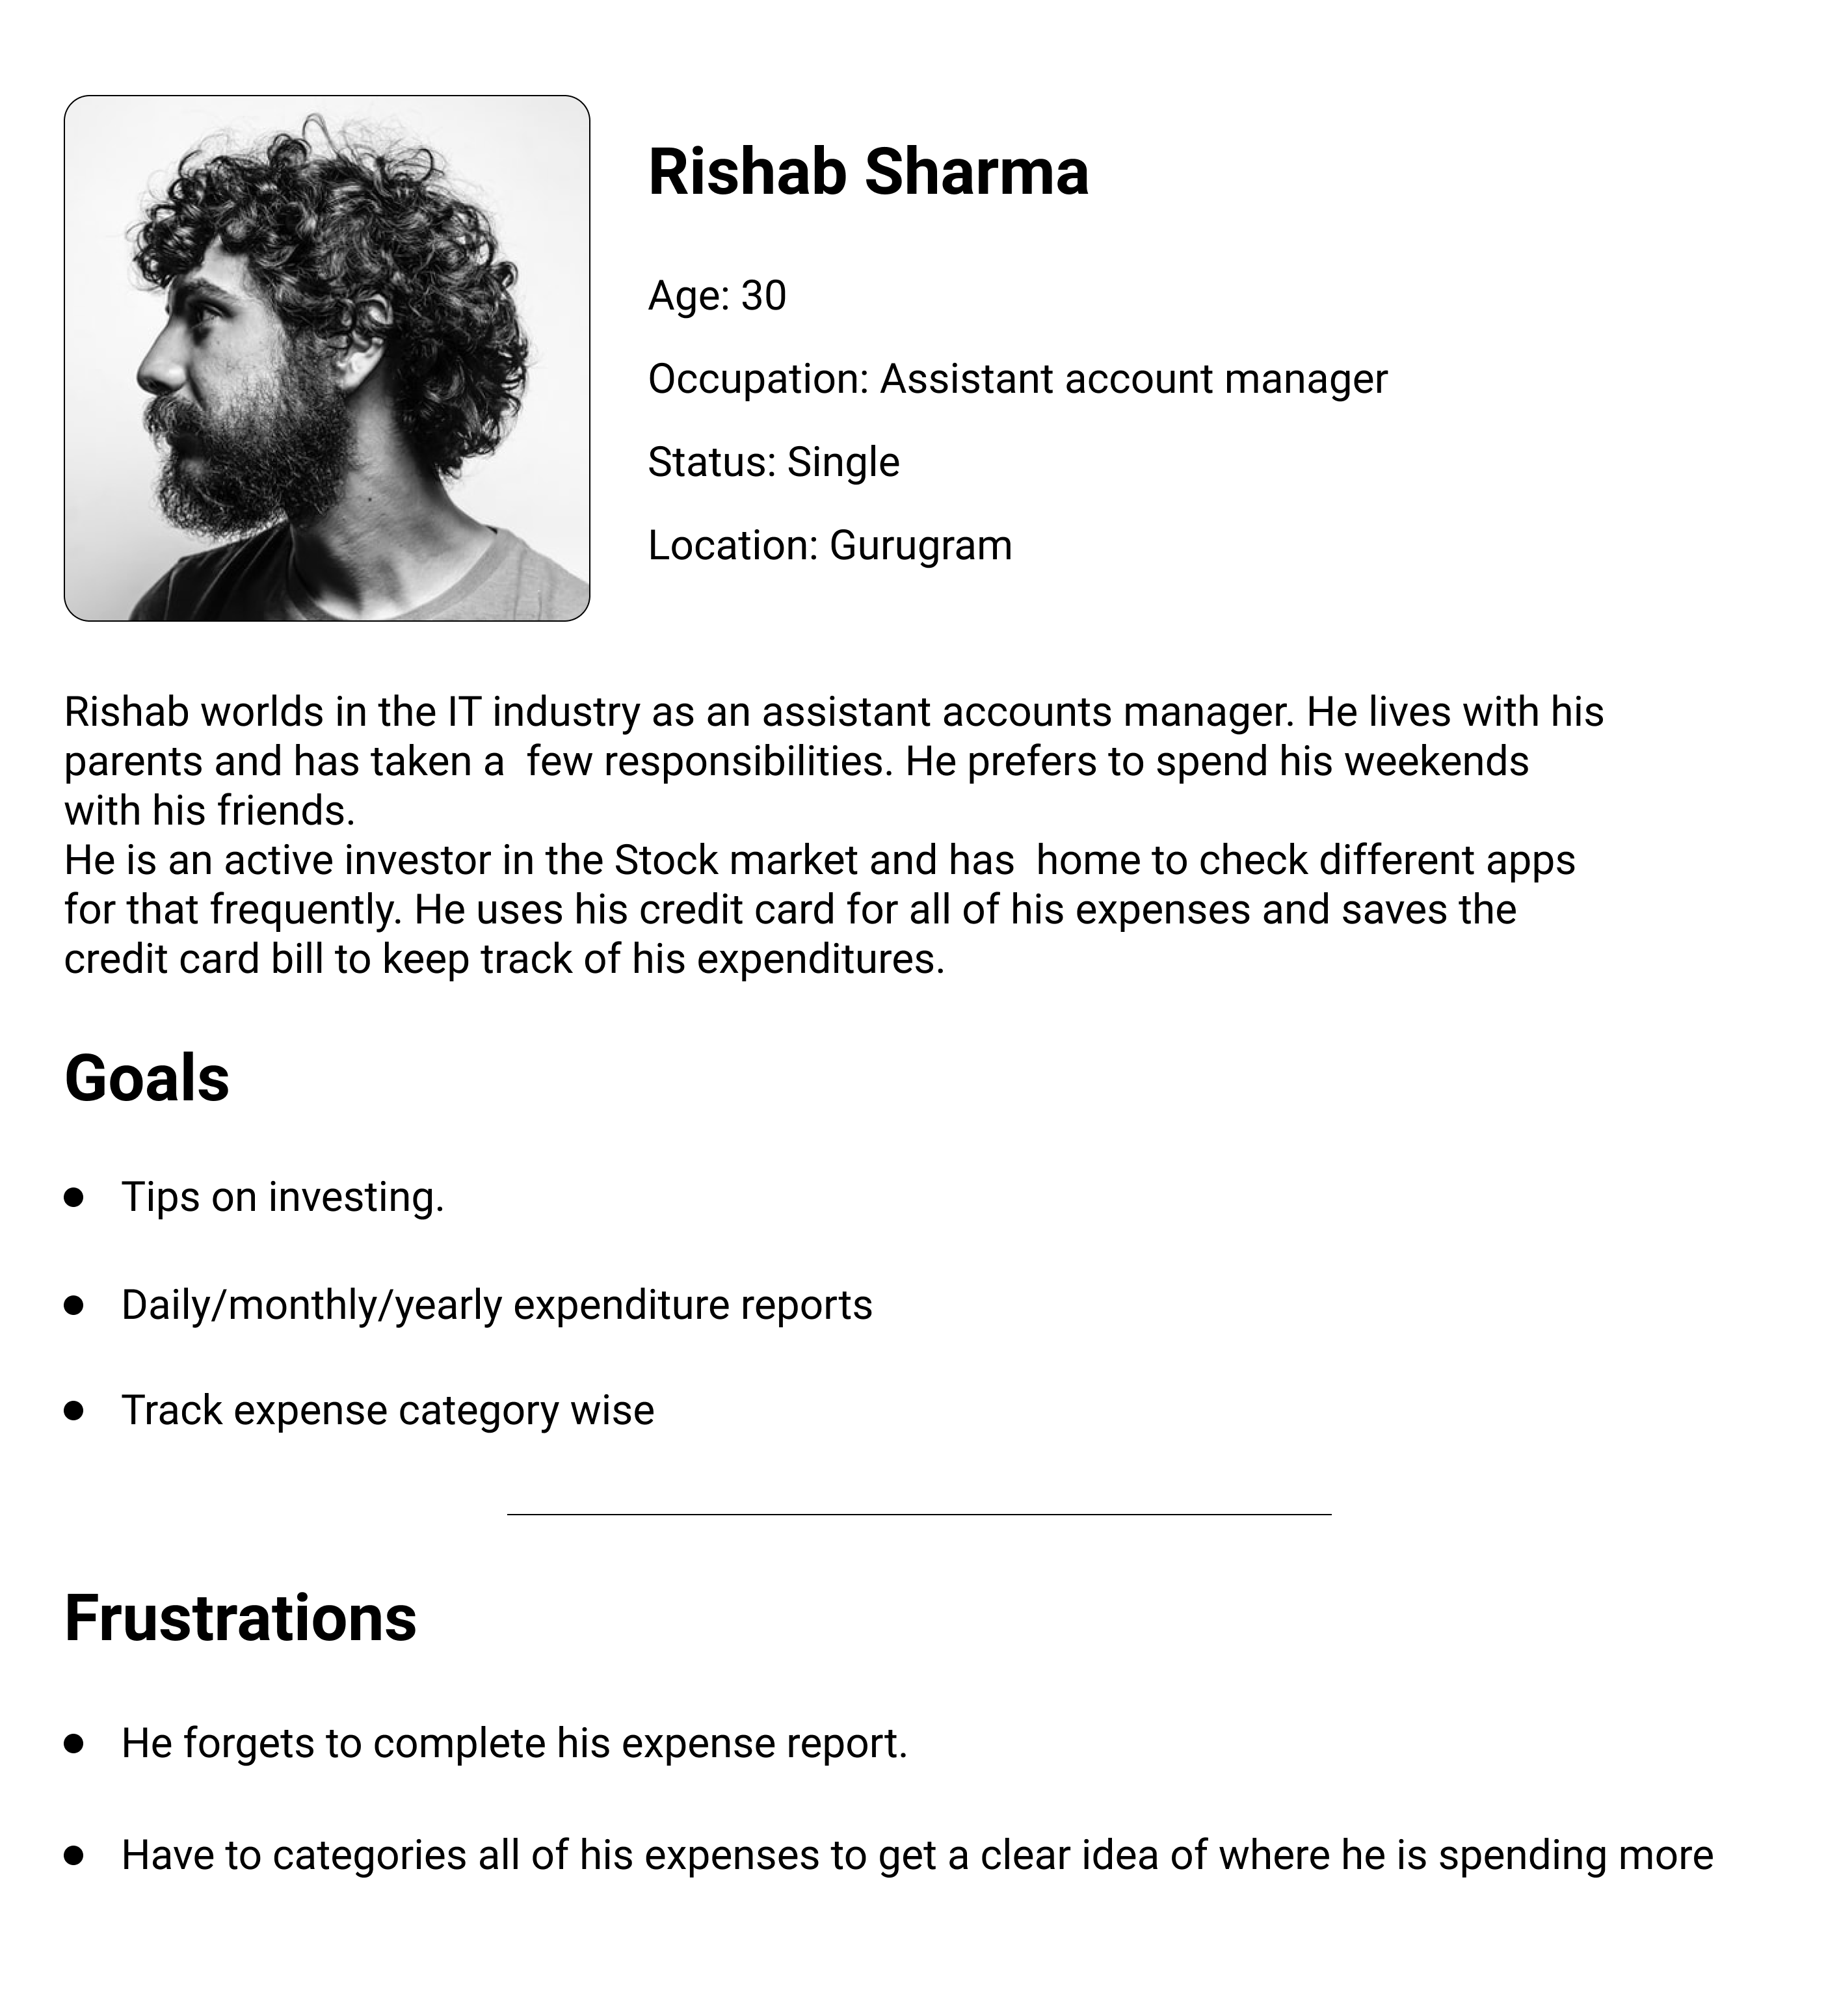
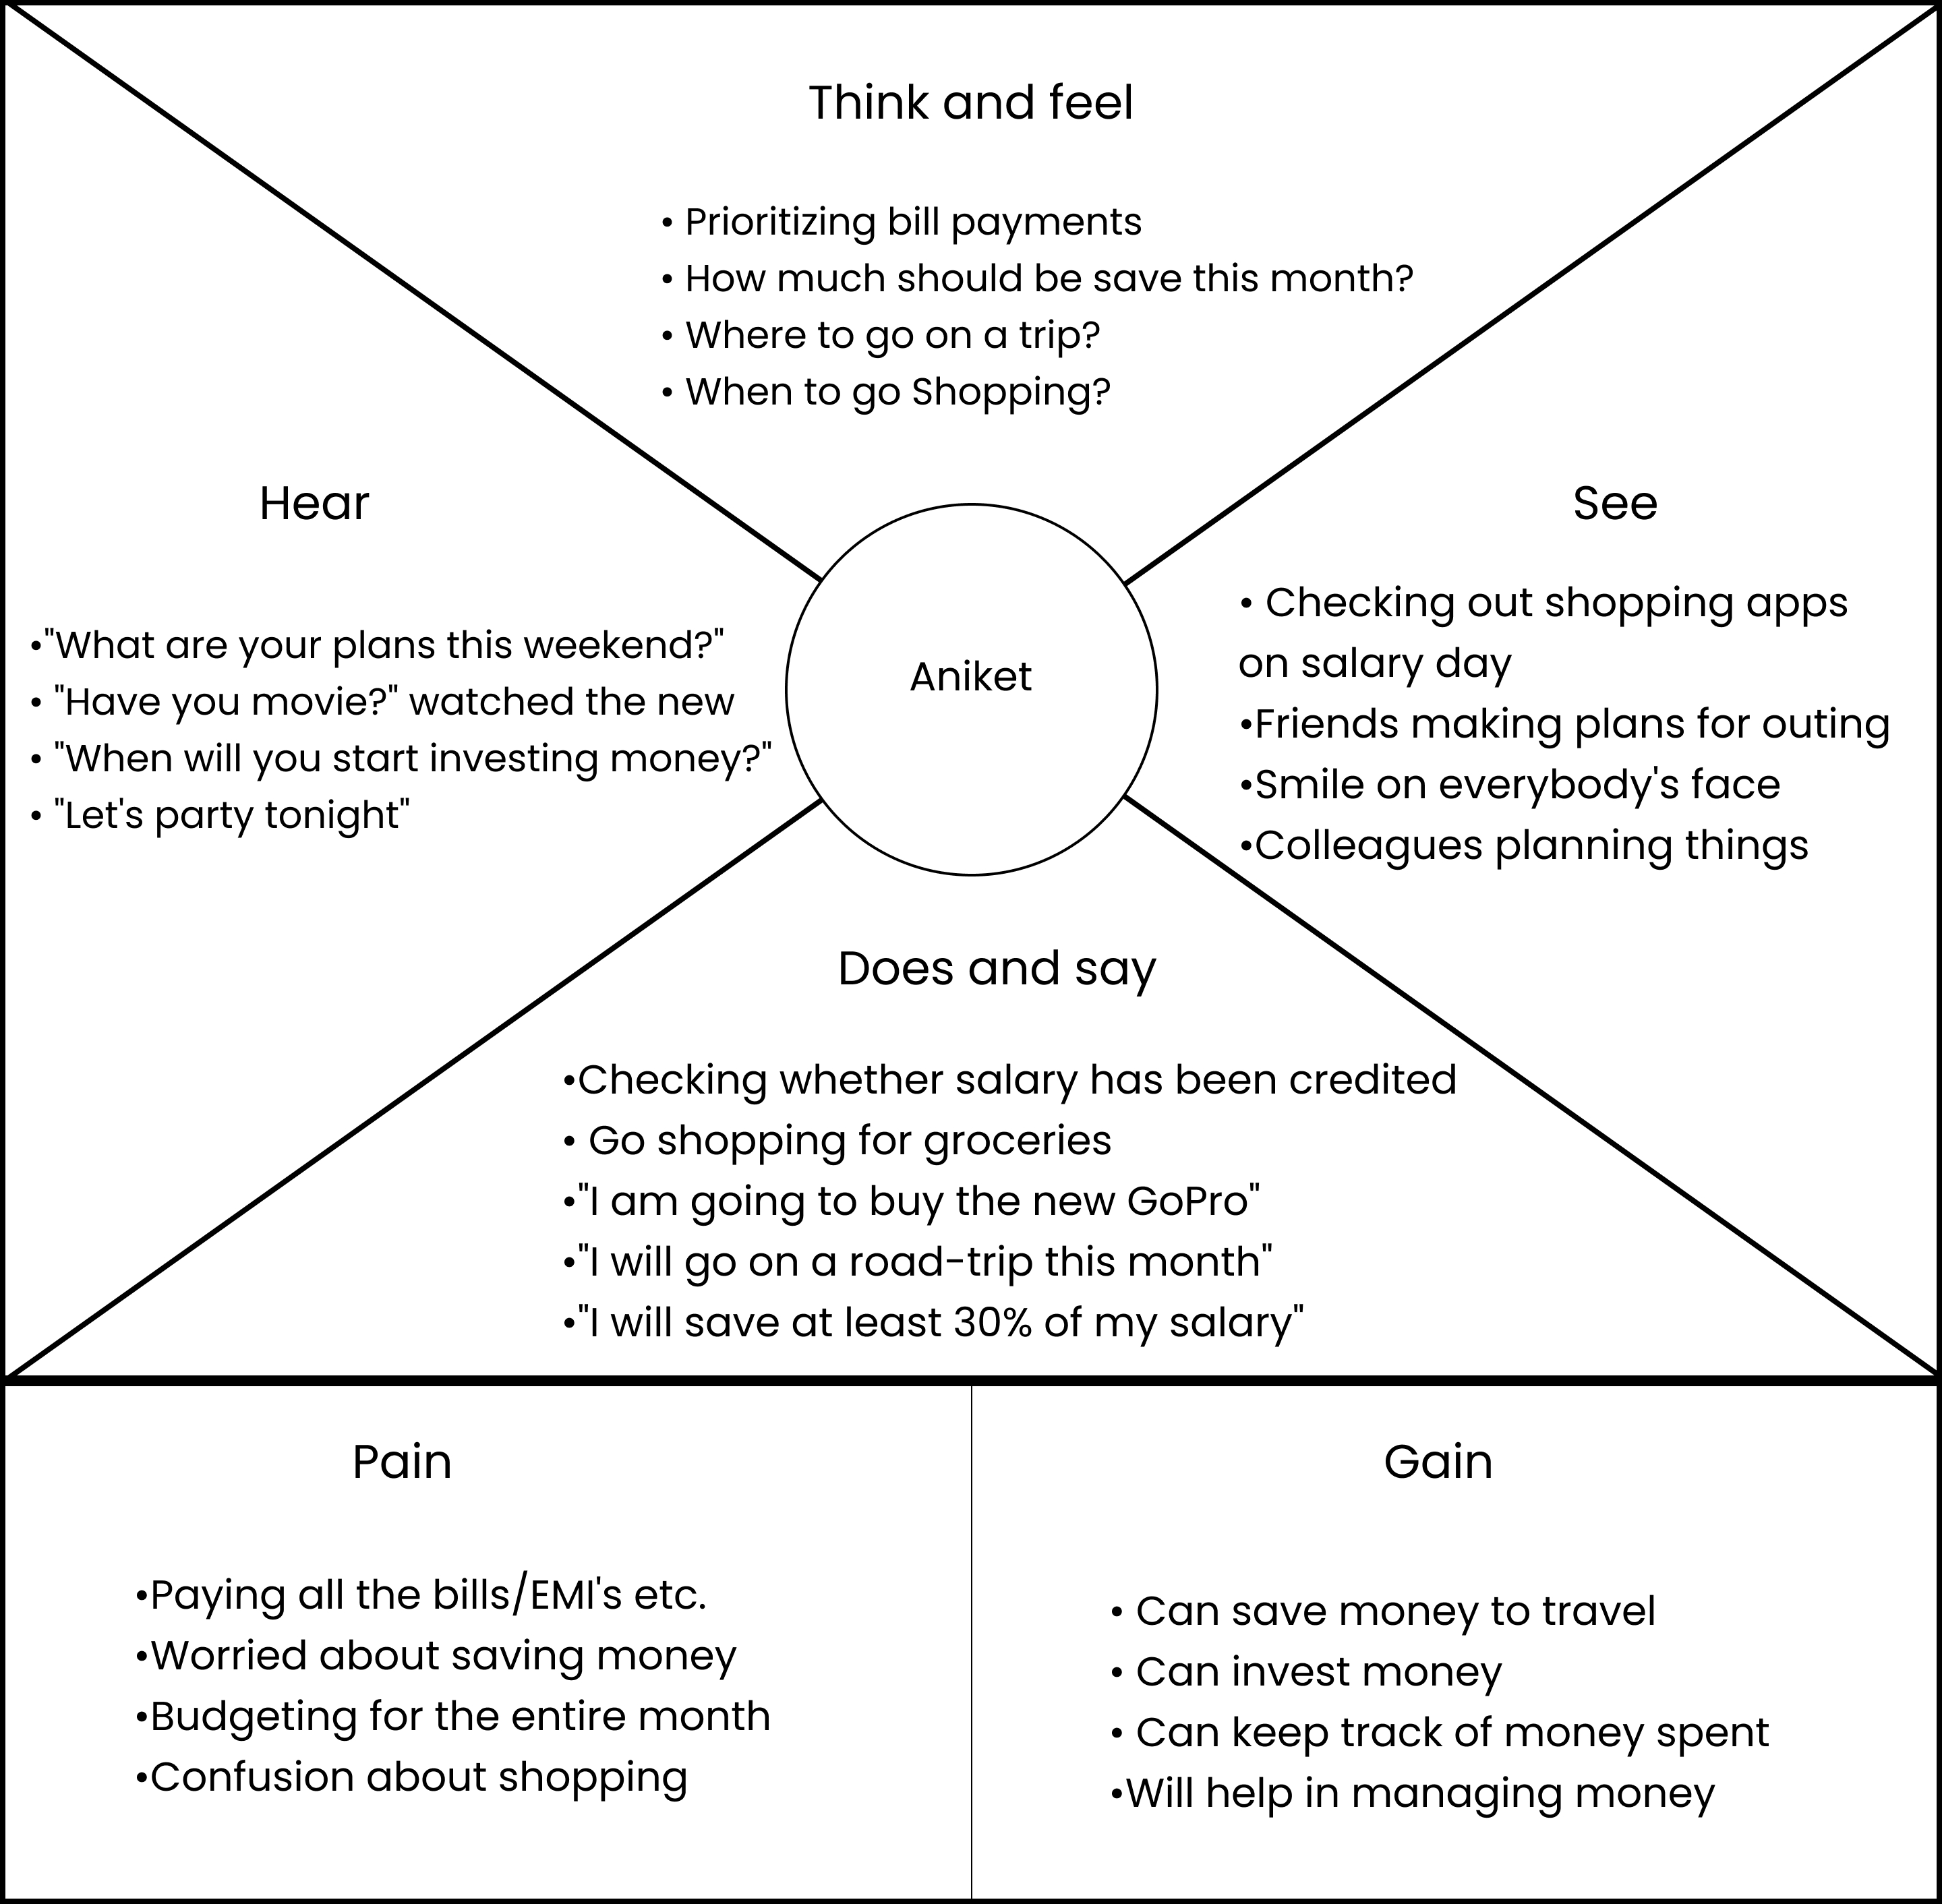
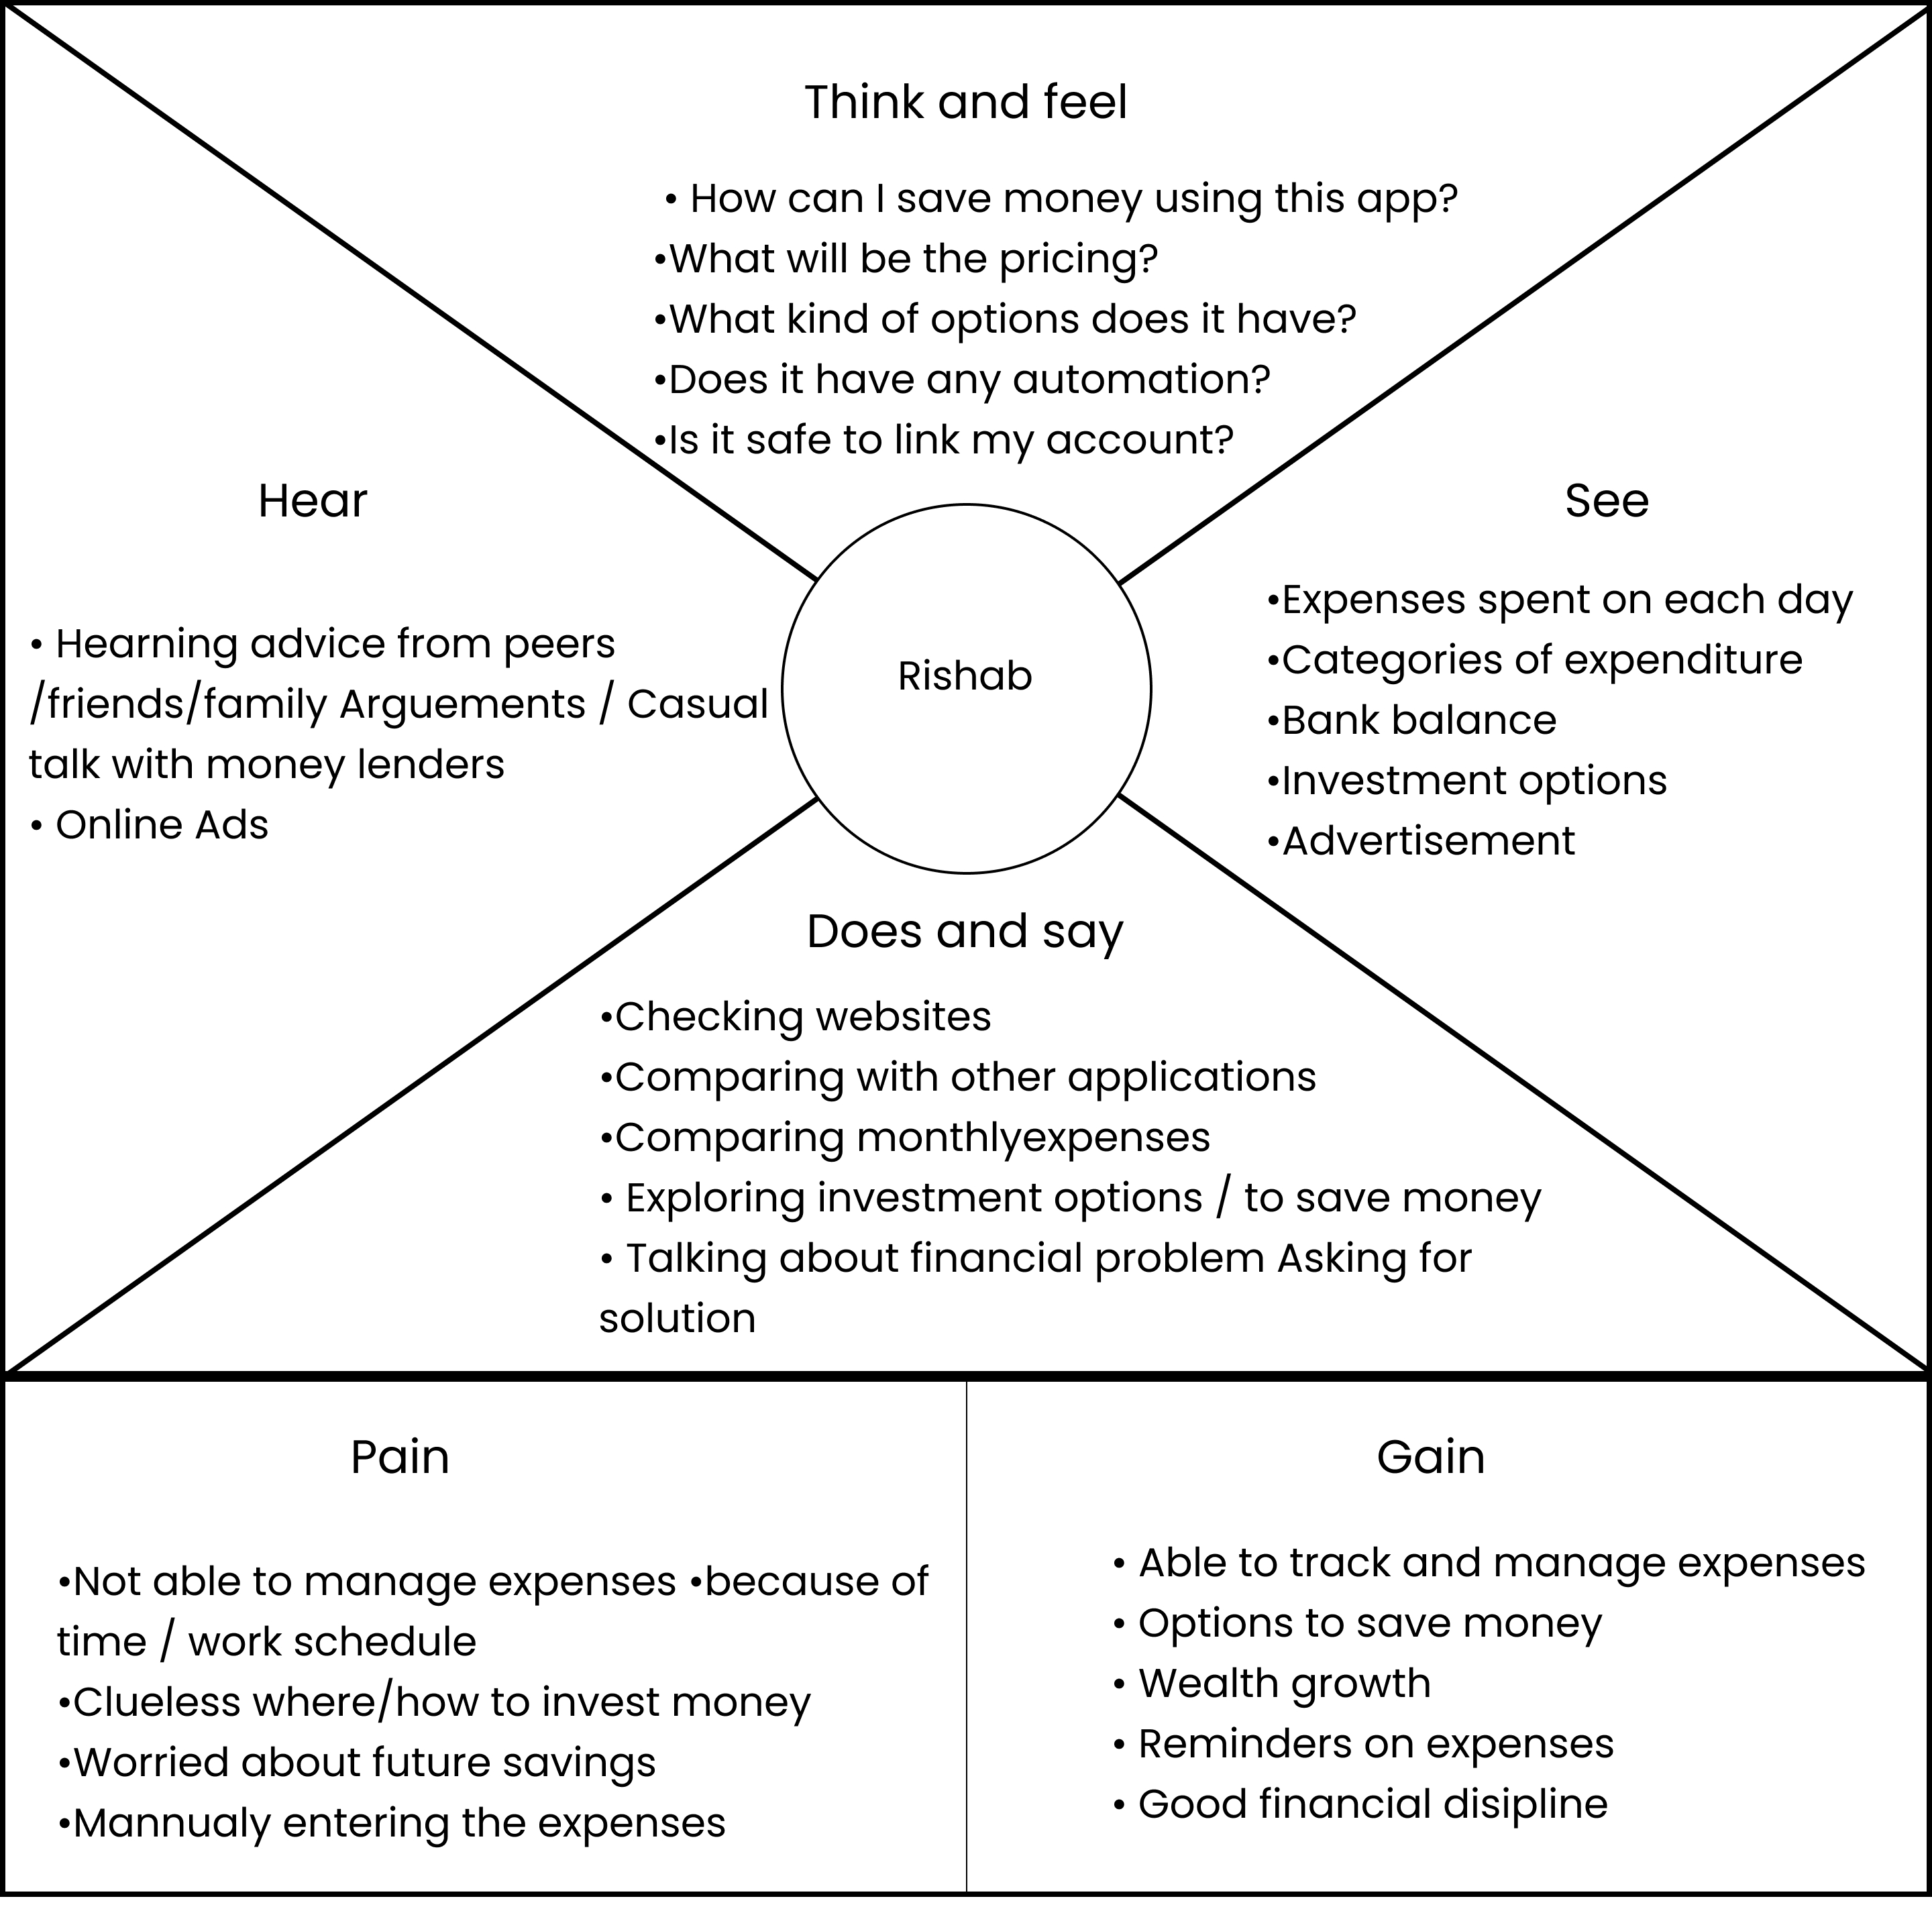
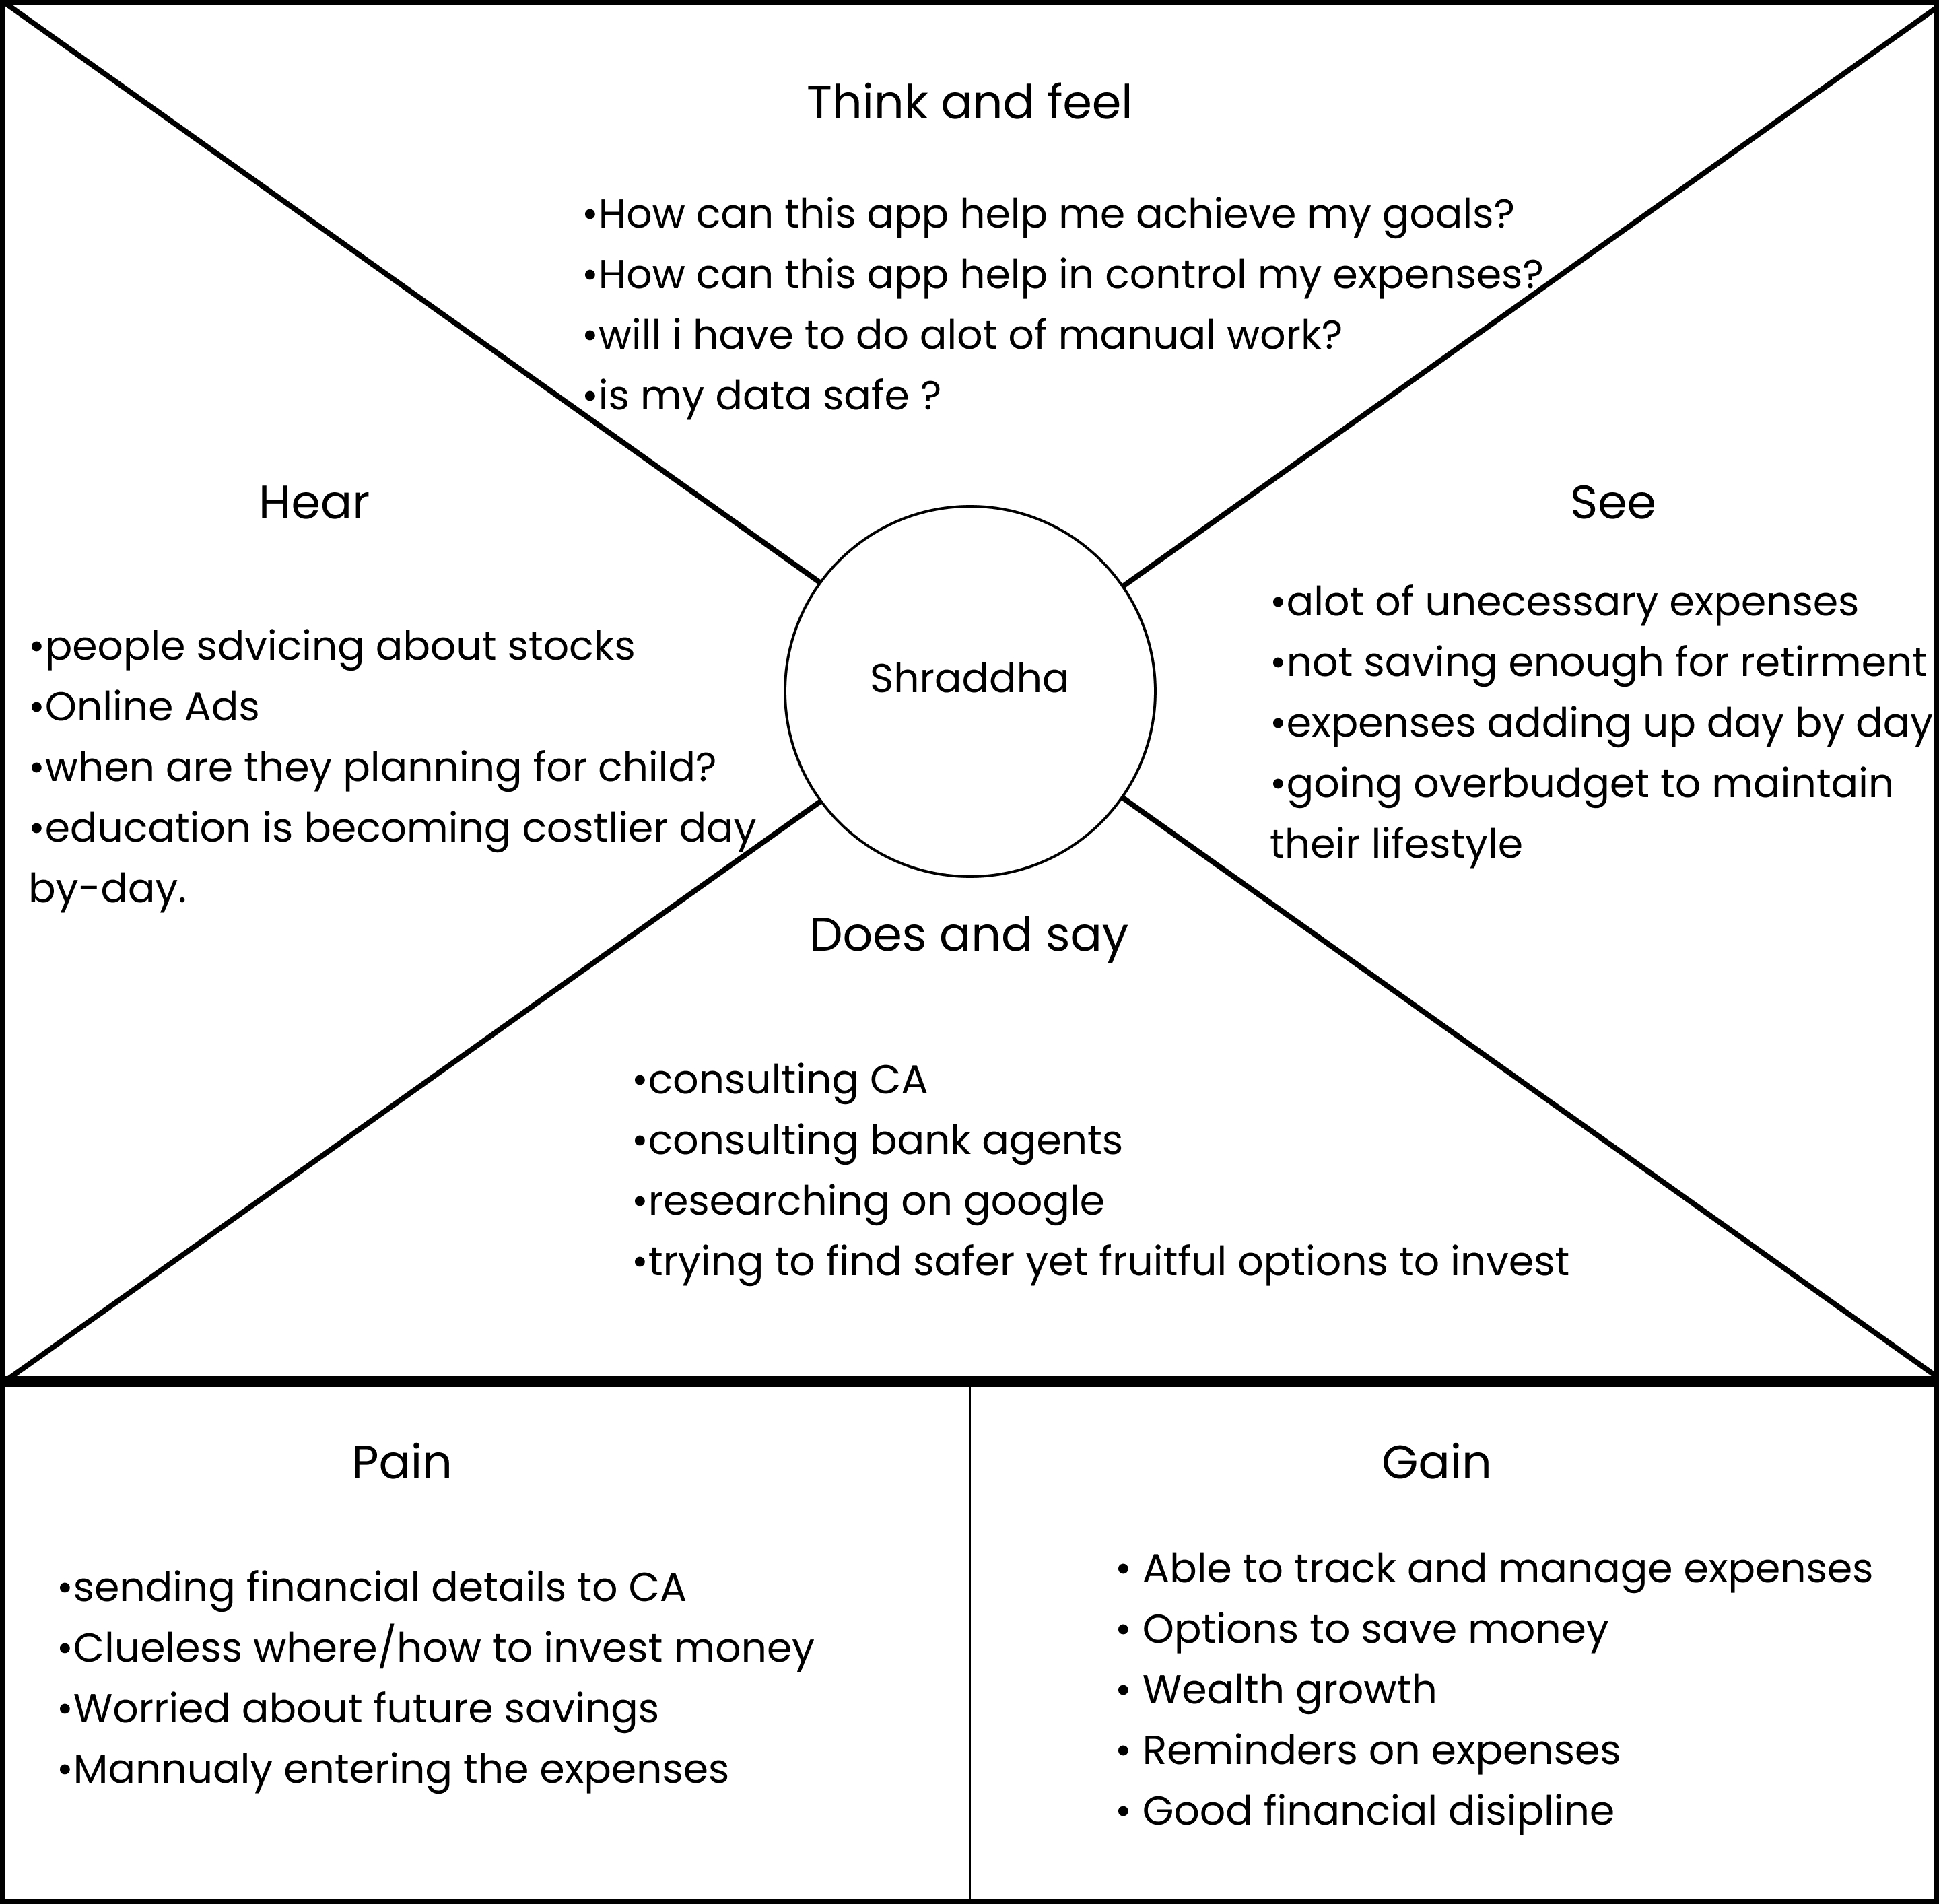
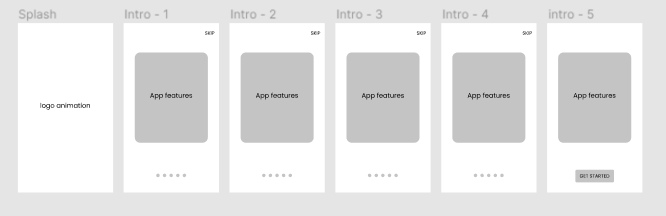
It provides a detailed view of your daily, weekly, and monthly spending by including visual representations like graphs. You can also set customized budgets and receive timely alerts regarding the same, which will take the user a step further in achieving financial freedom. ESI can also give you tips or suggestions on investing money using Artificial intelligence features.
- Focus on spending rather than investment.
- Absence of a Goal-based system.
- User does not know precisely how much money spent in which category, like food, bills, rent, entertainment, shopping, etc.
- Tracking and maintaining small expenses is quite tricky.
- The time-consuming process to manually write down all your expenses.
- Missing out on paying bills on time.
- Unable to track lent or borrowed money.
- Unable to Save and eventually invest Money.
- Too many alerts, reminders, or notifications.
- Forgetting to record auto-generated bills.
- Unaware of the current loan offers/ tax-saving opportunities.
- Unable to plan/set a monthly expense budget.
Because the inflation rates are growing every year, it doesn't matter how much we earn but what counts is how much we save.
There are many ways to track your expenses such as writing down on a piece of paper each time you spend your money or downloading your bank expenses etc. But at times there is some lapse in these methods such as losing your expense sheet forgetting to add an expense to the sheet or difficulty tracking cash transition.
This leads us to choose this project that could solve the problem of helping track your payments using a single platform and where you can Save, Compare, Confirm and Invest your money.
As the sole designer on this effort, I Worked on a complete end-to-end product design cycle, including User research, survey planning and execution, storyboards, design, and lo-fi, hi-fi wireframing, product goal on an expense & saving related fintech mobile application. Created initial Wireframe Sketches on paper, then converted to interactive browser Prototype before delivering the final product. Taking those insights and considerations, I applied UX laws, the double diamond design thinking process, the MOSCOW Model for features, and usability methods. Many factors were taken into account, and iterations were done.
It shows the value the product and services will bring to people and describes this value to a goal. It also defines the steps taken to achieve this goal.
ESI is designed to accomplish users’ tasks in the minor steps possible with just the right amount of notifications as they will be personalized for every user. ESI will help the end-user inculcate the habit of saving their hard-earned money and investing them wisely according to their life goal leading to a healthy and disciplined financial life.
- Recording the data (Automatic, Manual, and scan).
- Manage and track expenses.
- Setting Budget(daily, monthly, and category wise).
- Viewing reports in the desired format.
- Note daily spent money with category.
- Actionable notification.
- Exporting/sharing data in the desired format(excel, pdf).
- Easy to use.
- Graphical Representation of Data.
- Auto-Detection of payment.
- Expense, saving, and investment reports.
- To remove the manual action.
- Give users an end to end finance solution.
- Working professionals.
- Students with a limited budget.
- People of any age group planning to save money or have specific financial goals.
- Homemakers.
I started with doing online research about the pattern of savings and investment in India as I had Zero Idea about Finance.
- 60% of millennials spend more than 500 rupees on a single coffee
- 70% of millennials will spend a little extra to eat at the hip restaurants in town
- 69% of millennials buy clothes for reasons beyond basic necessity
- Over 50% of millennials spend money on taxis and Ubers.
The older generation used to focus on the future; hence, saving was one of their top priorities. But the younger generation is focusing on the present and has started following the western style of living, leading to 90% consumption of their salary on lifestyle.
Based on my secondary research, I assumed the research purpose and goal and created the user survey questionnaire.
The study was to understand how users currently solve the problem of expense tracking
User Research was performed in two ways:
1. Qualitative research
2. Quantitative research
Qualitative research is defined as a market research method that focuses on obtaining data through open-ended and conversational communication. This method is not only about what people think but also "why" they think so. An excellent example of a qualitative research method would be unstructured interviews that generate qualitative data through the use of open questions. It provides an in-depth understanding of the ways people come to understand, act, and manage their day-to-day situations in particular settings.
We conducted 25 face-to-face(on-call) user interviews to understand their challenges and pain points and gathered those data in the form of recordings.
Quantitative research inquires deeply into specific experiences, intending to describe and explore meaning through text, narrative, or visual-based data, by developing themes exclusive to that set of participants. Although there are many other methods to collect quantitative data like interviews, questionnaire observation, and document review are the most common and widely used methods, either offline or for online data collection.
We asked people to record their responses through online survey forms and questionnaires. Around 18 people participated in the survey and made this research a success.
A competitive analysis provides strategic insights into the features, functions, flows, and feelings evoked by the design solutions of your competitors
Average Search:
Robinhood - 44
Acorn - 23
Betterment - 4
Mint - 83
Wally - 8
Average Search:
IND Money - 1
ET Money - 2
Money view - 5
Mint - 76
- Display medicine lists with 'Add to Cart/Notify Me' options.
Simplicity is strength!
1st: I started to thread a thin line between overwhelming the users and boring them. This alone was an arduous task.
- I avoided jargon as much as possible.
- Created a termbase suitable for experts and beginners.
- Paid close attention to formatting standards.
2nd: Made users feel safe
- I always explained why certain data is needed.
- Made data collection as effortless as possible.
- Provided them with positive feedback in the process.
3rd: Helped users make sound decisions
- Helped users make informed financial decisions instead of emotional ones.
- I learned the importance of having a well-defined and close-ended problem statement.
As a designer, we are often lured by attractive, trendy and out of the box designs. But We must always remember the 'why.' The primary goal is to understand the user, their problems and then create a design that solves them.